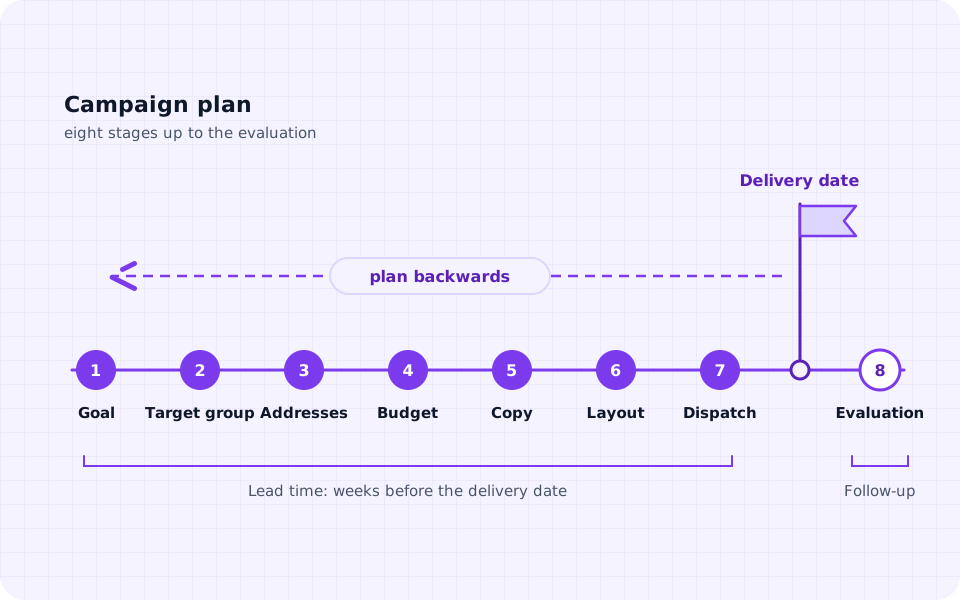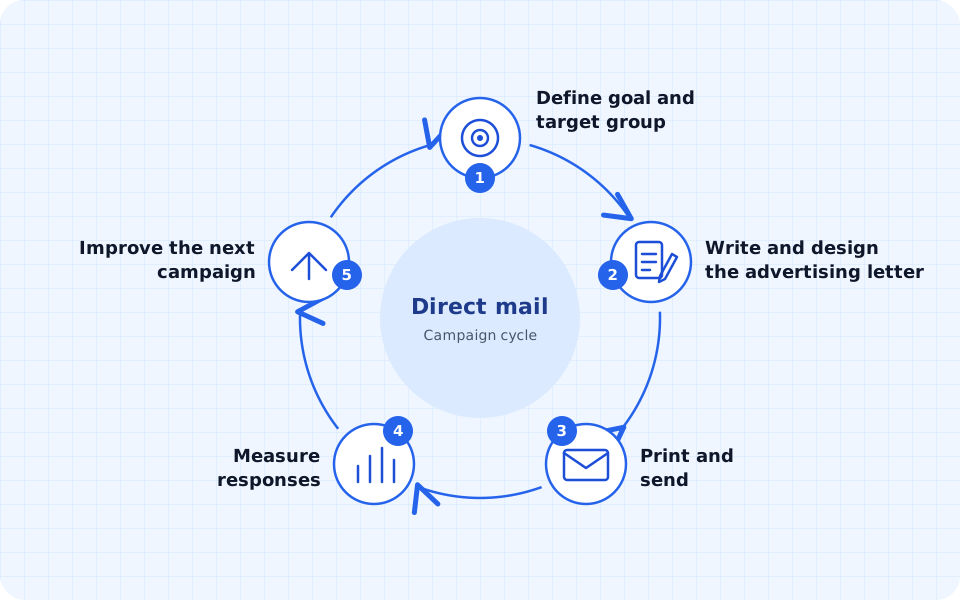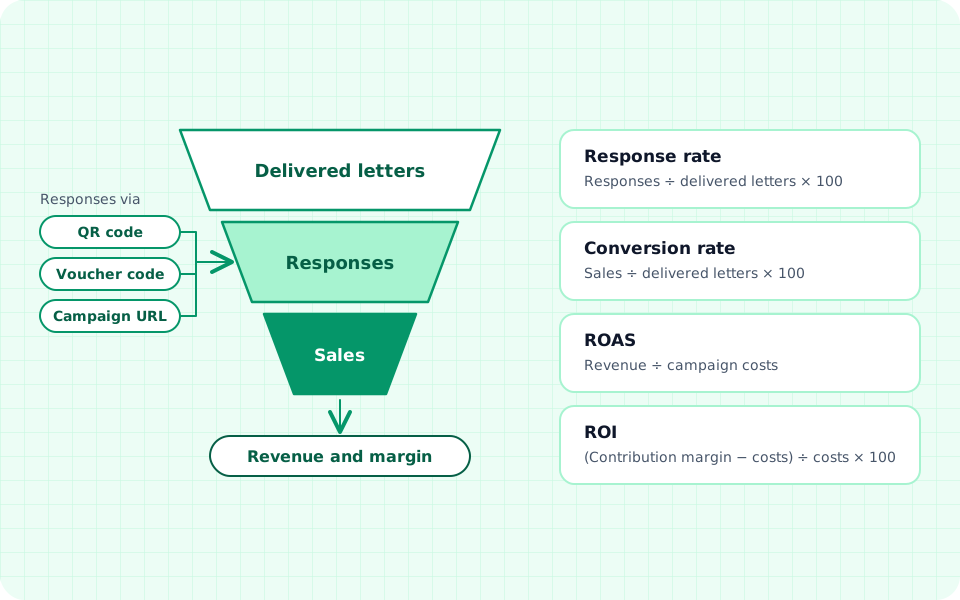
You do not measure the success of a direct mail campaign only after dispatch. Which metric counts and how responses find their way back to the letter is something you decide during planning. It is hard to catch up on that later.
Why measuring success pays off
Without measurement, every mailing is a gut feeling. With a few figures you can see whether the campaign paid off, which target group responds well and which variant performs better. This becomes the budget for the next campaign: more for what works, less for what brings nothing.
You do not need expensive software for this. To start with, clear response channels, a fixed evaluation period and a spreadsheet are enough.
Key metrics at a glance
These six metrics answer the questions after a mailing: who responded, what did it cost, what did it bring in? The reference figure is the delivered letters: the letters sent minus the returns that come back as undeliverable.
| Metric | Formula | What it tells you |
|---|---|---|
| Response rate | Responses ÷ delivered letters × 100 | How many recipients responded at all |
| Conversion rate | Sales ÷ delivered letters × 100 | How many recipients bought, booked or signed |
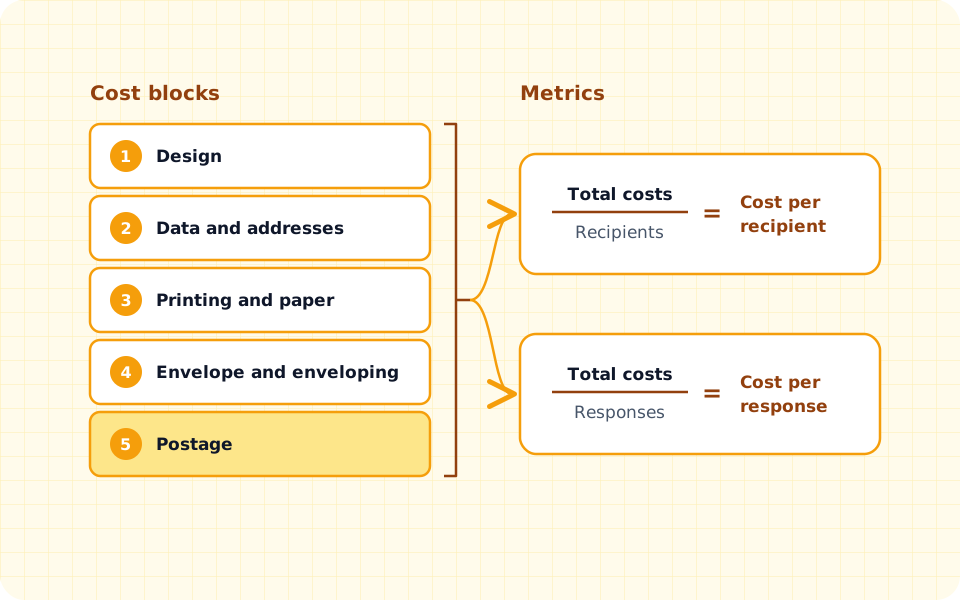
| Cost per response | Campaign costs ÷ responses | What one contact cost |
| Cost per sale | Campaign costs ÷ sales | What a customer or order cost, comparable with other channels |
| ROAS | Campaign-related revenue ÷ campaign costs | How much revenue each euro spent has brought in |
| ROI | (Contribution margin from the campaign − campaign costs) ÷ campaign costs × 100 | Whether a profit remains after all costs |
You define what a response is yourself: a call, a visit to the campaign URL, a redeemed code. For the conversion rate, some businesses relate the sales not to the delivered letters but to the responses. Both are common. What matters is that you choose one definition and keep it for every campaign. Campaign costs include dispatch, design, addresses, redeemed discounts and working time. The guide direct mail costs shows which items these are in detail.
Telling revenue, contribution margin and profit apart
There is an easy mistake to make when assessing results: revenue is confused with profit. From every euro of revenue, the cost of goods and variable costs are deducted first, such as material, shipping to the customer or payment fees. What is left is the contribution margin. Only this has to cover the campaign costs.
That is why a ROAS above 1 does not yet mean a profit. A ROAS of 2 means: every euro of campaign costs has brought in two euros of revenue. If your contribution margin is 30% of revenue, 60 cents of that remain, so the campaign loses money. The break-even point is a ROAS of 1 ÷ contribution margin ratio, which at 30% is about 3.33.
Worked example: all metrics calculated
Worked example with assumed values. The figures are made up and are not benchmarks.
An online retailer of kitchen accessories writes to existing customers. 2,000 letters are delivered. The campaign costs €2,500 in total. 100 recipients respond, 40 of them order. The average order value is €180, the contribution margin 30% of revenue.
| Metric | Calculation | Result |
|---|---|---|
| Response rate | 100 ÷ 2,000 × 100 | 5% |
| Conversion rate (based on delivered letters) | 40 ÷ 2,000 × 100 | 2% |
| Conversion rate (based on responses) | 40 ÷ 100 × 100 | 40% |
| Cost per response | €2,500 ÷ 100 | €25.00 |
| Cost per sale | €2,500 ÷ 40 | €62.50 |
| Revenue | 40 × €180 | €7,200 |
| Contribution margin | €7,200 × 30% | €2,160 |
| ROAS | €7,200 ÷ €2,500 | 2.88 |
| ROI | (€2,160 − €2,500) ÷ €2,500 × 100 | −13.6% |
The ROAS of 2.88 looks decent, yet the campaign loses €340. To break even with a contribution margin of €54 per order (€180 × 30%) it would need at least 47 orders instead of 40. If the campaign wins new regular customers who buy again later, it can still pay off over time. Calculate such repeat purchases separately, though, and only if you can actually prove them.
Attributing responses: tracking in the advertising letter
No metric is better than the attribution behind it. A letter has no click that a tool counts automatically. You therefore need response channels that reveal where they came from. It is best to combine two of them, for example a QR code and a voucher code.
Campaign URL with UTM parameters
UTM parameters are additions to a web address that your analytics tool evaluates as source, medium and campaign. A campaign URL can look like this:
https://www.example.de/autumn?utm_source=advertising-letter&utm_medium=print&utm_campaign=autumn-2026Nobody types out an address that long. So print a short address of its own in the letter, such as example.de/autumn, and redirect it to the long URL on your website.
QR code in the advertising letter
A QR code takes people straight to the campaign URL by smartphone. Give it a parameter of its own, for example utm_content=qr, and you can see separately who scanned and who typed. A QR code that is the same for all recipients measures the campaign as a whole. For two variants, use two codes with different URLs.
Voucher codes
A campaign-exclusive code such as AUTUMN26 is quick to set up and shows how often the offer was used. Such codes are often passed on, though, including on voucher forums. Individual codes for each recipient cannot be shared and show exactly who responded. They take more effort and touch on data protection (see below). Before dispatch, check that every code works in the shop and at the checkout.
Dedicated extension number and reply slip
A phone number that appears only in the mailing counts calls without any questions. Where that is not possible, the team asks callers on the phone for the code from the letter and notes it down. A reply slip to send back gets a campaign reference so that it can later be assigned to the right campaign.
Landing page tracking
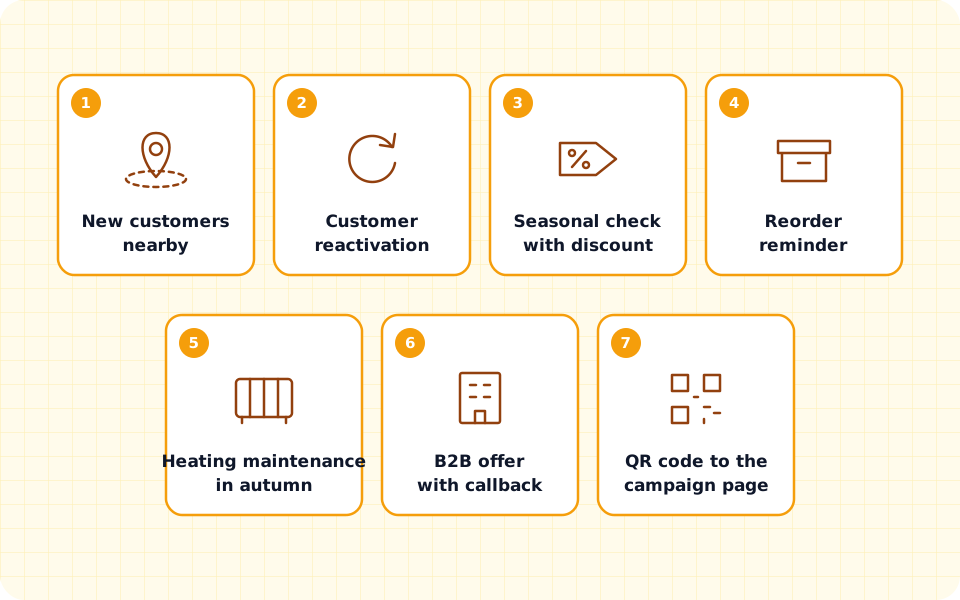
A landing page of its own that can only be reached through the mailing collects all online responses. There you measure visits, completed forms and orders. The page should show exactly the offer from the letter, not the general home page. How campaigns with a code, QR code and landing page work together is shown by the direct mail examples.
A/B test and control group
An A/B test compares two versions of a mailing. For the result to mean anything, three rules apply:
- One variable: The variants differ in exactly one point, such as the subject line, the offer or the colour. Change more and you do not know what worked.
- Random split: Divide the recipients at random, for example with a random number per row in the spreadsheet. Both groups receive the letter on the same day.
- Large enough groups: The smaller the expected difference, the more recipients each group needs. With small groups a difference can be pure chance.
A control group goes one step further: a randomly selected part of the target group receives no letter at all. Afterwards, compare how much both groups bought in the same period. Only the difference is due to the mailing, because some customers would have ordered anyway. Suppose that in the worked example above a control group of the same size without a letter had generated 10 orders: then only 30 of the 40 orders are really due to the mailing.
Evaluation and interpretation
- Evaluation period: Decide beforehand until when responses count, for example the offer deadline plus a follow-up period. Some recipients keep the letter and respond weeks later.
- Channel overlap: Anyone who receives the letter and also sees an email or an ad may order without a code. Such purchases do not show up in any attribution. The control group makes this effect visible.
- The right comparison: Measure the result against your own goal, the break-even point and earlier campaigns, not against average figures from other industries.
- Documentation: Record dispatch date, target group, variant, costs and all metrics in one place. Only then do campaigns become comparable over time.
A table with one row per response is enough for the evaluation. These columns make sense:
- Date of the response
- Response channel, such as QR code, campaign URL, voucher code or phone
- Variant or recipient group
- Outcome: response only or also a sale
- Revenue and, if known, contribution margin
From this table you derive all the metrics above with a few formulas. Enter responses continuously and not only at the end of the period, otherwise calls and notes get lost.
Optimising the mailing campaign
The evaluation shows where to start. You have these levers in your hands:
- Target group: Reduce or drop groups with a weak response, expand groups that respond well.
- Offer: Adjust value, deadline and conditions.
- Copy and subject line: State the benefit earlier and more clearly.
- Response channel: Make responding easier, for example with a QR code instead of a long address.
- Timing: Move the dispatch day and the season.
- Costs: Check page count, colour and print run. From 5,000 items per campaign, the Dialogpost advertising rate is worth considering at briefsenden; smaller print runs you send as a mail merge.
Change only one lever per round, otherwise you will again not know what worked. The guide planning a direct mail campaign describes how to schedule the next round. The direct mail guide gives the complete overview.
Data protection when tracking
If you only count how often a campaign code was redeemed, you need hardly any personal data for it. It is different if you attribute responses to individual recipients, for example through individual codes. Then you are processing personal data and need a legal basis for it. Recipients should learn from your privacy notices that you evaluate responses and how.
On the landing page the following also applies: under the TDDDG (the German Telecommunications Digital Services Data Protection Act), cookies and similar techniques that are not strictly necessary to operate the page generally require consent. This affects many analytics tools. Check the details case by case. The guide Advertising by post and the GDPR gives an overview of the rules for advertising letters.
Measurable advertising letters with briefsenden
In the letter editor you insert a QR code into the letter, for example with your campaign URL. It is the same for all recipients of a document and thus measures the campaign. For an A/B test you create two documents with different codes and send each variant as its own mail merge to its own CSV list.
You create individual voucher codes or QR codes for each recipient yourself beforehand and combine the finished letters into a combined PDF. In the dashboard you see the dispatch status of every letter. There is no tracking up to the letterbox for standard letters; you measure responses through your own response channels.